Interpreting AdWords statistics
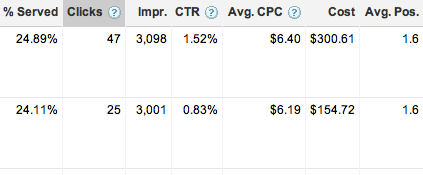
I’ve blogged before about how to interpret CTR and what conditions are necessary for a valid comparison of two ads. In one recent case we created two identical ads that went to different landing pages so that we could test the effectiveness of each landing page. The assumption is that each ad — being identical — will deliver virtually identical traffic to each landing page. Well, here’s what we found in AdWords:
Note that these were identical running for the same time period (% Served) and at the same ad position. Under such circumstances, we would expect the number of clicks and CTR to be roughly the same, but here they differ by a factor of 3.
Is this a statistically significant difference? We would expect random variation to produce a standard deviation of about 3 to 5 clicks (roughly the square root of the number of clicks), in which case these numbers are several standard deviations apart. That’s a lot. That’s highly unlikely in statistical terms. So what’s going on?
We often discuss with clients what the statistics mean, and we often point out that differences in performance are well within a standard deviation and thus we can’t draw firm conclusions without more data. In this case the differences exceed what could usually be explained by “normal” statistical variance, that something else must be at play. Possible explanations include the landing pages’ quality scores or algorithmic anomalies that favor one ad over the other. Either of these would generate discrepancies in the number of impressions and/or average ad position, neither of which we see. The only remaining explanation is that something about the landing page for each makes Google display them slightly differently, perhaps with more Sitelinks for the first ad than the second.


July 13th, 2011 at 8:02 pm
Now you have me wondering about the validity of some ad tests I ran earlier this year. With wild variation in the clicks rates on identical ads (supposedly show to randomly chosen individuals from the same audience pool) you really have to wonder.
I think you are correct in assuming the Google was simply offering one of the ads far more frequently than the other. What if you assume that and then correct for it? You should then be able to derive the original landing page data you were seeking.
July 14th, 2011 at 12:58 pm
Unfortunately in the case above (and a couple of others), the number of impressions is identical, so it’s NOT a matter of them being shown a different number of times.
Whenever comparing ads, make sure the impressions (or % served) numbers are very similar, otherwise they might not match up in time and thus could have different underlying causes for their different performances. For instance, an ad that runs for January might perform differently from one that runs in July due to seasonal demand. Even partially overlapping isn’t sufficient, you need to look at periods that both ads run for the same entire period. For instance, you shouldn’t compare performance of an ad for January and February with another for only February as the January performance of the first ad could change for other reasons and skew the two-month results.